
First Trust Three on Thursday
Brian S. Wesbury - Chief Economist
Robert Stein, CFA - Dep. Chief Economist
March 21, 2024
In this week’s edition of “Three on Thursday,” we take a deeper look at the Consumer Price Index (CPI). The CPI is a key measure of inflation, measuring the average change in price over time of a market basket of consumer goods and services. Its broadest and most widely used index, the Consumer Price Index for All Urban Consumers (CPI-U), represents over 90% of the U.S. urban population. The CPI-U reflects the cost of essential items such as food, apparel, housing, fuel, transportation, medical services, pharmaceuticals, and other products and services purchased for everyday living by nearly all urban residents, excluding those in rural areas, the military, and those in institutions, such as mental hospitals and prisons. Prices are collected monthly from 75 urban areas across the country from about 6,000 housing units and around 22,000 retail establishments. The CPI-U uses these prices, weighted by their importance in consumer spending, to calculate average price changes, which are then used to gauge inflation. To offer deeper insights, we’ve included three informative charts below.
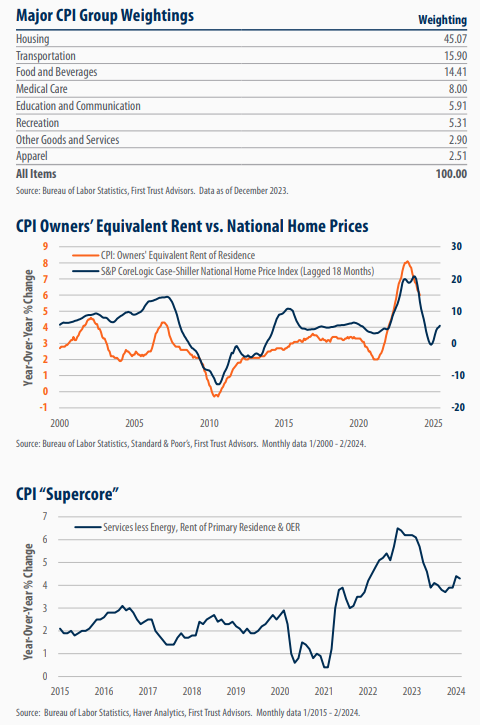
The CPI-U consists of over 200 categories that are arranged into eight major groups, with weightings based on consumer spending patterns. The Bureau of Labor Statistics (BLS) calculates each category’s share of total expenditures by totaling the expenditures reported by households for each item and then determines the proportion of total expenditures that each item represents. In essence, items or categories where consumers spend a larger portion of their income will have higher weights in the CPI, indicating their greater importance in the overall index. The BLS now updates these weightings annually, using recent Consumer Expenditure Survey data to keep the CPI relevant and accurately reflect shifts in consumer spending on various goods and services. The largest group weighting by far in the CPI-U is housing which makes up 45% of the overall index weighting.
Housing, with a substantial 45% weighting, constitutes the largest share of the Consumer Price Index (CPI), with the Owner’s Equivalent Rent (OER) being its most significant component at a 26% overall weighting in the CPI. In essence, OER measures the change in the amount a homeowner would pay in rent or earn from renting his or her home in a competitive market. The investment portion that comes with purchasing a home is excluded in OER, so home prices are not factored into the estimate. This estimation is achieved through the CPI Housing Survey, which follows the rents of a large sample of renter-occupied housing units. Each month, one-sixth of a pricing area (called a panel) is measured, with all six panels priced twice a year. This methodology causes the CPI’s rent measures to lag behind market indices like Zillow and CoreLogic, particularly because the CPI captures rents for ongoing tenancies rather than just new listings, and only measures an area every six months. There is a very high correlation between home prices lagged 18 months and OER. If this relationship holds moving forward, the growth rate of OER should continue slow, putting downward pressure on the overall CPI.
Since November 2022, the Federal Reserve has honed its focus on a narrower inflation measure known as “supercore” inflation. Powell has highlighted its significance, stating that supercore inflation “may be the most important category for understanding the future evolution of core inflation.” Traditionally, core CPI excludes food and energy prices to provide a clearer view of inflation trends. The Fed’s approach to supercore inflation refines this perspective even further. Powell, along with other senior Fed officials, categorize core inflation into three segments: core goods, housing services, and core services minus housing. The latter category, often referred to as supercore, has garnered considerable attention. This focus stems from the Fed’s belief that service sector inflation, unlike goods prices, is predominantly influenced by labor costs—a factor the Fed can influence through interest rate adjustments. Raising interest rates typically cools economic activity, leading to slower hiring rates or even layoffs, thereby affecting inflation. In contrast, they believe goods prices are more susceptible to global dynamics like supply chain variations. Relative to the overall CPI, supercore has remained much more stubbornly elevated.
The attached information was developed by First Trust, an independent third party. The opinions are of the listed authors at First Trust Advisors L.P, and are independent from and not necessarily those of RJFS or Raymond James. All investments are subject to risk. There is no guarantee that these statements, opinions, or forecasts provided in the attached article will prove to be correct. Individual investor's results will vary. Past performance does not guarantee future results. Forward looking data is subject to change at any time and there is no assurance that projections will be realized. Any information provided is for informational purposes only and does not constitute a recommendation. Investing involves risk and you may incur a profit or loss regardless of strategy selected.